Central Coast

All species are below average, with dramatic declines of Chinook and chum salmon

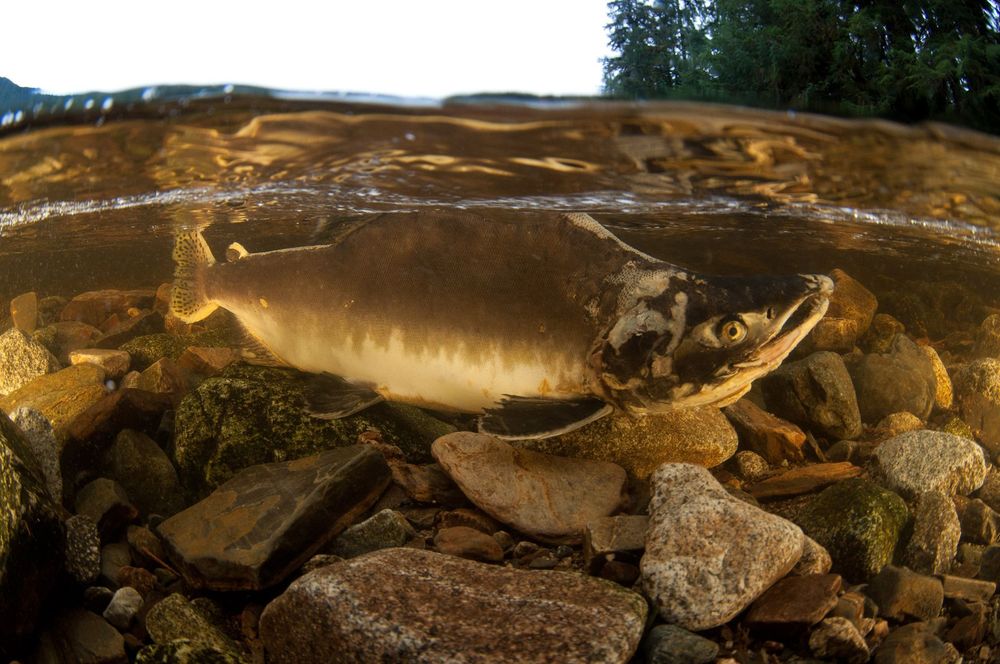
On the Central Coast, numerous small coastal watersheds have given rise to the greatest salmon biodiversity of any region. This biodiversity is being threatened as spawners decline across all species and monitoring cutbacks on the Central Coast means that in many cases we can’t properly track what is being lost. Declines in salmon monitoring in the region have been well documented, and yet improvements have not been made: fewer than 50% of historically surveyed streams on the Central Coast have been visited in the past 10 years.


Chinook and chum are both well-below the long-term average and are a significant conservation concern. In 2022, Chinook abundance was at an all-time low and chum abundance was one of the lowest on record.


Sockeye spawners have been below average since the mid 1990s are currently well-below the long-term average. Historically, Owikeno Lake and Long Lake were one of the three largest salmon runs in British Columbia. These populations have been decimated and all major commercial sockeye fisheries in the region have been curtailed.


Commercial fisheries in this region harvest a mix of salmon returning to rivers on the Central Coast and more southern regions, making it difficult to assign catch to this region and calculate total abundance. As a result, our assessment of Central Coast salmon is based on spawner abundances only.

Salmon speciesSalmon species

State of Salmon - Central Coast

question icon
Species
Current State
Trends
Short-Term
Long-Term

OUR APPROACH


There are different ways to measure the state of salmon, and each approach tells us something unique about how salmon are doing.  


CURRENT STATE is the spawner or total abundance over the most recent generation as a per cent anomaly from the long-term average and provides information on how abundant salmon are now relative to past years.


TRENDS measure the direction of change, either over the short-term (most recent three generations) or long-term (all available years). This is complementary information to the current state, and a species that has a declining trend may be a conservation concern even if the current status is above average.


Click on a species for an interpretation of the current state and trends.

Arrows indicate if the trend in abundance is increasing or decreasing

Arrows indicate if the trend in abundance is increasing or decreasing

A horizontal line indicates if the trend in abundance is stable

A horizontal line indicates if the trend in abundance is stable

A question mark indicates an unknown current state or trend due to a lack of readily accessible data

A question mark indicates an unknown current state or trend due to a lack of readily accessible data

question icon
Spawner Abundance (% anomaly)
+150%+100%+50%0%-50%-100%
Increased AbundanceDecreased Abundance
?

SPECIES NOT PRESENT

SPECIES NOT PRESENT

SPECIES NOT PRESENT

SPECIES NOT PRESENT

SPECIES NOT PRESENT

SPECIES NOT PRESENT

SPECIES NOT PRESENT

SPECIES NOT PRESENT

SPECIES NOT PRESENT

SPECIES NOT PRESENT

SPECIES NOT PRESENT

SPECIES NOT PRESENT

How to Interpret this Graph
Each fish above shows the per cent anomaly of current spawner or total abundance over the most recent generation compared to the long-term average (horizontal line) for each region and species. 


Interested in more learning more? Check out the Pacific Salmon Explorer for a data-driven look at Pacific salmon Conservation Units and their habitats within each region.


For more details on our assessment approach, view our Methods.

Well-above long-term average. No conservation concern.

Above long-term average. Current outlook is good.

At or near long-term average. Precaution is warranted.

Below long-term average. Current outlook is poor.

Well-below long-term average. Significant conservation concern.

?

Unknown current state due to a lack of readily accessible data. 

REGION PROFILE

Central Coast

7 Conservation Units

Conservation Units are irreplaceable groups of salmon that have unique genetic and life-history traits. Maintaining multiple Conservation Units within a region strengthens the resilience of the species as a whole and helps it withstand and adapt to changing conditions. The number of Conservation Units provides a good indication of the salmon biodiversity in the region.

SPECIES NOT PRESENT

Major Salmon-Bearing Rivers

Bella Coola River
Atnarko River
Quaal River
Kemano River
Kainet Creek

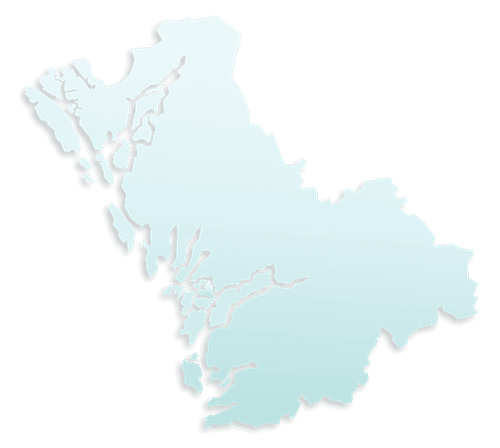
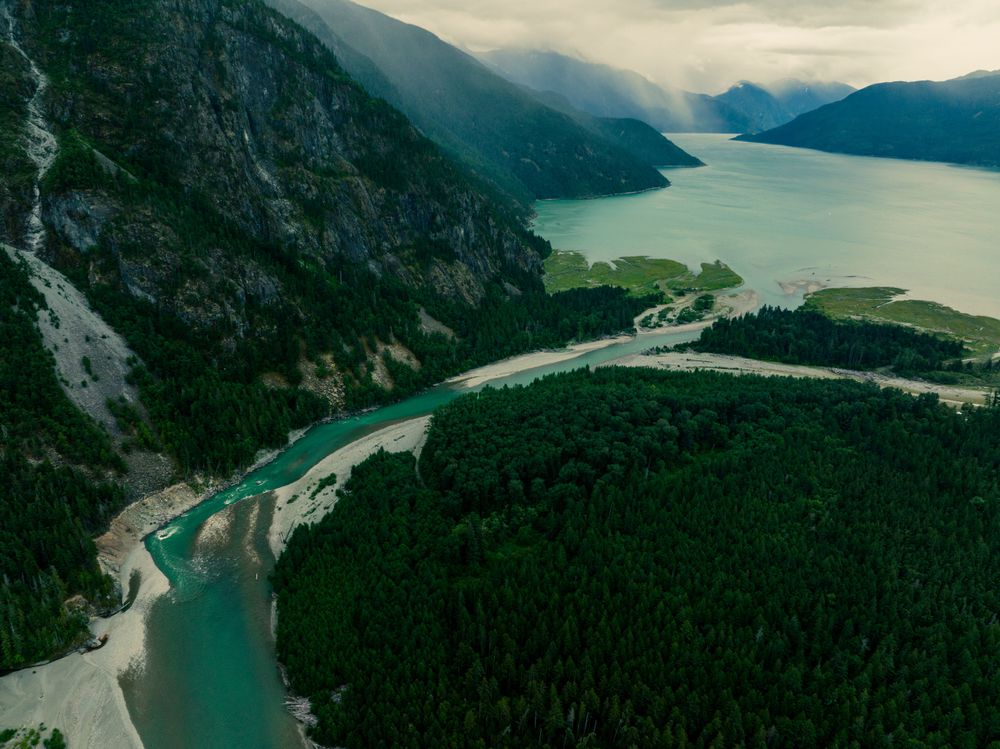
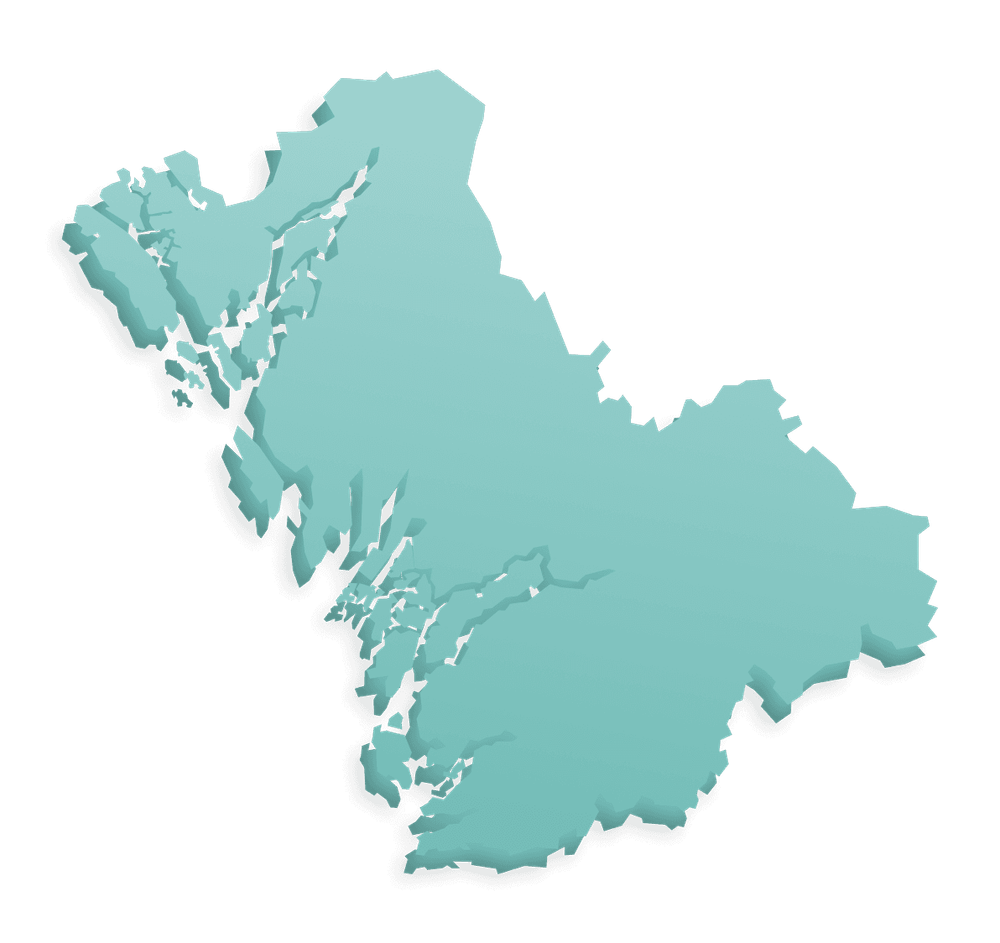
The Central Coast Region is part of the Great Bear Rainforest, one of the largest remaining tracts of unspoiled temperate rainforest left in the world. The Central Coast stretches from Douglas Channel and Banks, McCauley, and Pitt Islands in the north to Rivers Inlet and Smith Inlet in the south, covering 54,813 square kilometres. It comprises large inland fjords, thousands of coastal islands, and 18 small- to medium-size rivers that drain more than 132,400 square kilometres of streams into Hecate Strait and Queen Charlotte Sound.


With a diversity of stream, river, lake, and estuary habitats, the region offers some of British Columbia’s most intact and productive spawning habitats, which support a rich diversity of salmon. All six species of salmon and steelhead occur on the Central Coast, with hundreds of uniquely adapted populations. 

Salmon species